![Laudio_Wordmark_RGB_Color (1)-3.png]](https://support.laudio.com/hs-fs/hubfs/Laudio_Wordmark_RGB_Color%20(1)-3.png?height=41&name=Laudio_Wordmark_RGB_Color%20(1)-3.png)
The Usage Over Time Leaderboard helps leaders understand how consistently teams are engaging with Laudio over time. By viewing monthly trends, leaders can monitor adoption, identify opportunities for coaching, and measure the impact of rollout and enablement efforts.
Key Benefits:
- Track engagement trends over time.
- Monitor Laudio adoption across teams and facilities.
- Identify opportunities for coaching and support.
Using the Usage Over Time Leaderboards
The Usage Over Time Leaderboard helps answer important questions about platform engagement, such as:
- Is Laudio adoption increasing, remaining steady, or declining?
- Which groups of leaders are highly engaged?
- Where may additional support or coaching be needed?
Leaders can use this information to understand engagement patterns and make informed decisions about training, communication, and adoption efforts.
Available Reports
Laudio Action Index (LAI) Over Time
The Laudio Action Index (LAI) is a measure of engagement based on actions completed for team members. This displays month-over-month utilization trends and helps track engagement over time.

Total Actions by Month
Shows the number of actions completed each month, providing visibility into leader engagement with their teams.

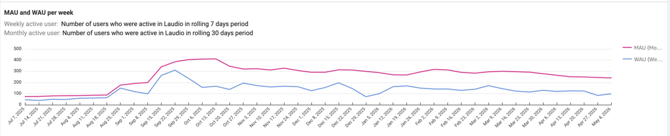
Monthly Active Users (MAU) and Weekly Active Users (WAU)
Measures monthly and weekly platform engagement.
Target Actions by Month (Rolling 90 Days)
Target actions are the number of recommended actions assigned based on team member needs. This shows the number of target actions assigned each month during the previous 90 days based on assigned team members.

Actions Taken by Month (Rolling 90 Days)
Displays monthly action activity over the previous 90 days.

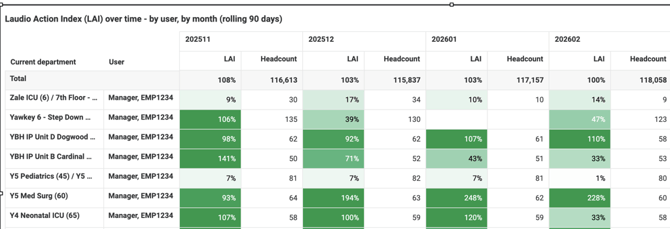
Laudio Action Index (LAI) by User and Month (Rolling 90 Days)
Shows each user's LAI based on the previous 90 days of activity. Headcount (the number of team members assigned to a leader during the selected time period) is included to help provide context for changes in engagement and activity levels.
Example: The value displayed for November 2025 includes activity from September 2025, October 2025, and November 2025.
Filters
Use the available filters to customize the data displayed:
- Region
- Facility
- Time Period (Year-Month)
- User
Data includes the current year and the previous three full calendar years.
Common Use Cases
Leaders often use the Usage Over Time Leaderboard to:
- Support monthly business reviews.
- Monitor adoption during new feature rollouts.
- Identify opportunities for leader coaching.
- Recognize highly engaged teams and leaders.
- Measure the effectiveness of enablement efforts.
FAQs
Q: Why does the LAI chart use rolling 90-day data?
A: Using a rolling 90-day period helps show broader engagement trends instead of focusing on short-term fluctuations.
Q: Why do I only see certain users in the report?
A: Access is based on management scope. Leaders can only view data for users within their reporting hierarchy.